Note: E-Commerce reports require the Pro version of the “HT Easy Ga4” and “WooCommerce” plugins activated.
1. Account Overview #
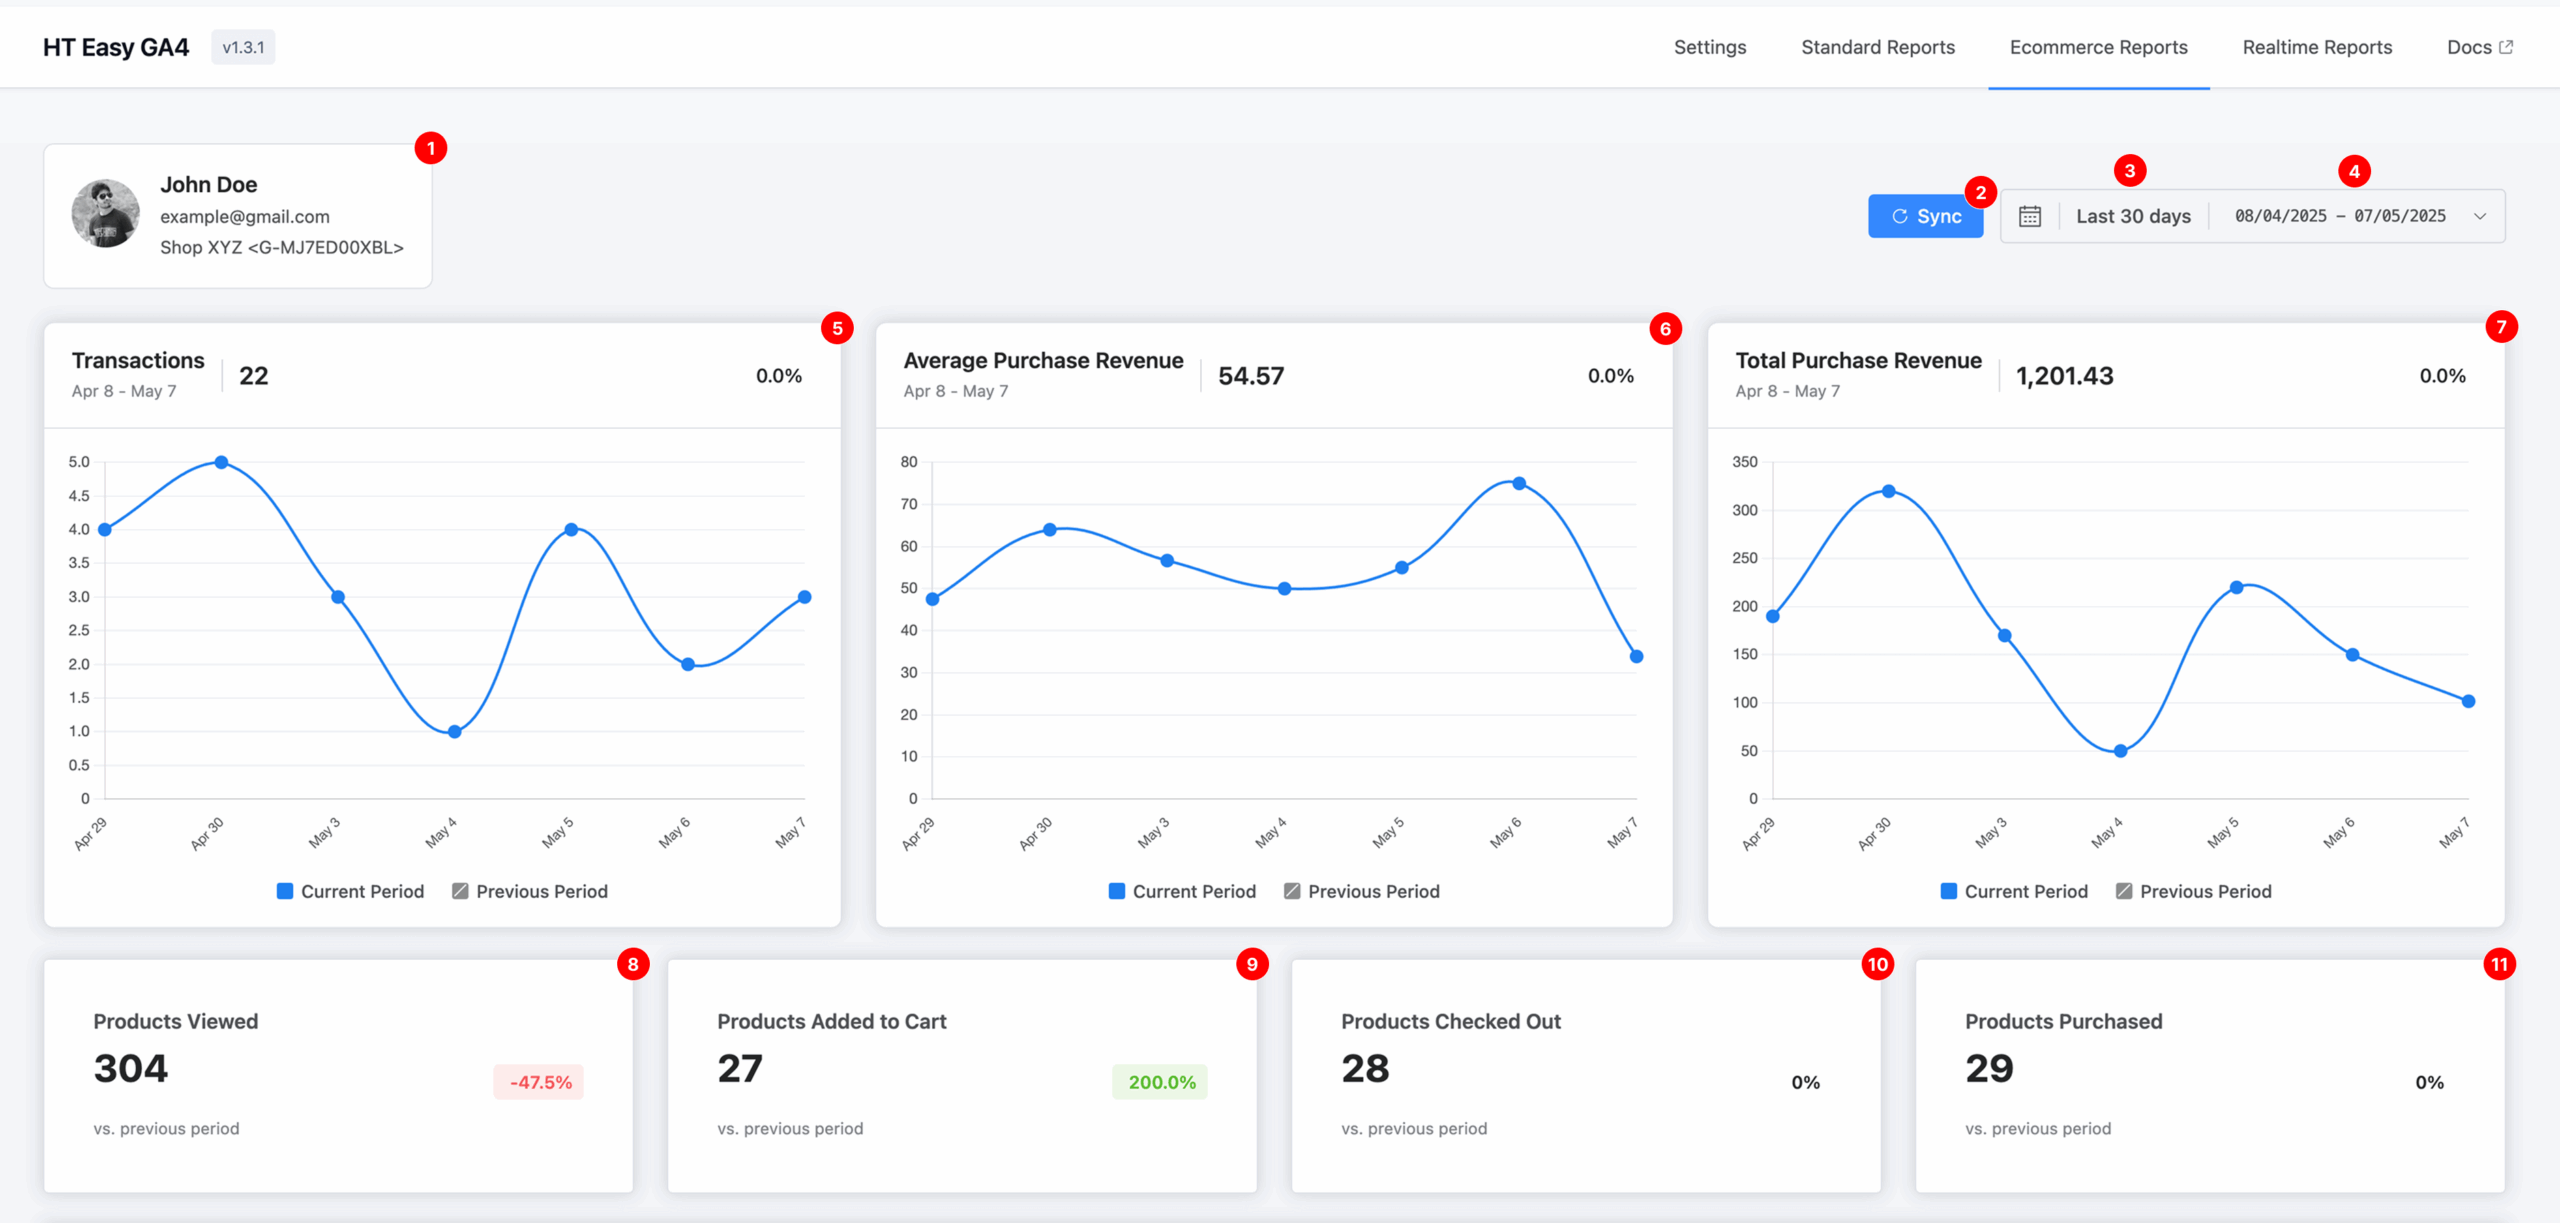
Displays the connected Google Analytics account and the GA4 Measurement ID associated with the ecommerce data being reported.
2. Sync #
Click the Sync button to pull the most recent ecommerce data from your GA4 property. This ensures your reports are up to date with the latest metrics.
3. Default Date Range #
By default, the dashboard shows data from the last 30 days.
This allows you to quickly review your store’s recent performance.
4. Custom Date Range Selector #
Use the calendar tool to select any custom date range.
This enables analysis over specific promotional periods, holidays, campaigns, or other time-sensitive events.
✅ Note: The period comparison toggle from the previous version has been removed for a cleaner experience.
5. Transactions #
Shows the total number of completed purchases for the selected date range.
The line chart helps visualize daily transaction trends and identify buying patterns.
6. Average Purchase Revenue #
Displays the average revenue generated per transaction.
This metric helps assess whether customers are spending more or less over time.
7. Total Purchase Revenue #
The sum of all sales within the selected period.
This is a key performance metric that reflects the gross revenue generated through your online store.
8. Products Viewed #
Tracks how many product pages were viewed.
Use this to determine which products are attracting customer attention.
9. Products Added to Cart #
Shows how many times items were added to the shopping cart.
This indicates purchase interest and helps identify high-converting product listings.
10. Products Checked Out #
Displays how many products reached the checkout stage.
This helps track shopping funnel activity and potential drop-offs during checkout.
11. Products Purchased #
Indicates the total number of products successfully purchased.
A valuable metric for understanding sales conversion.
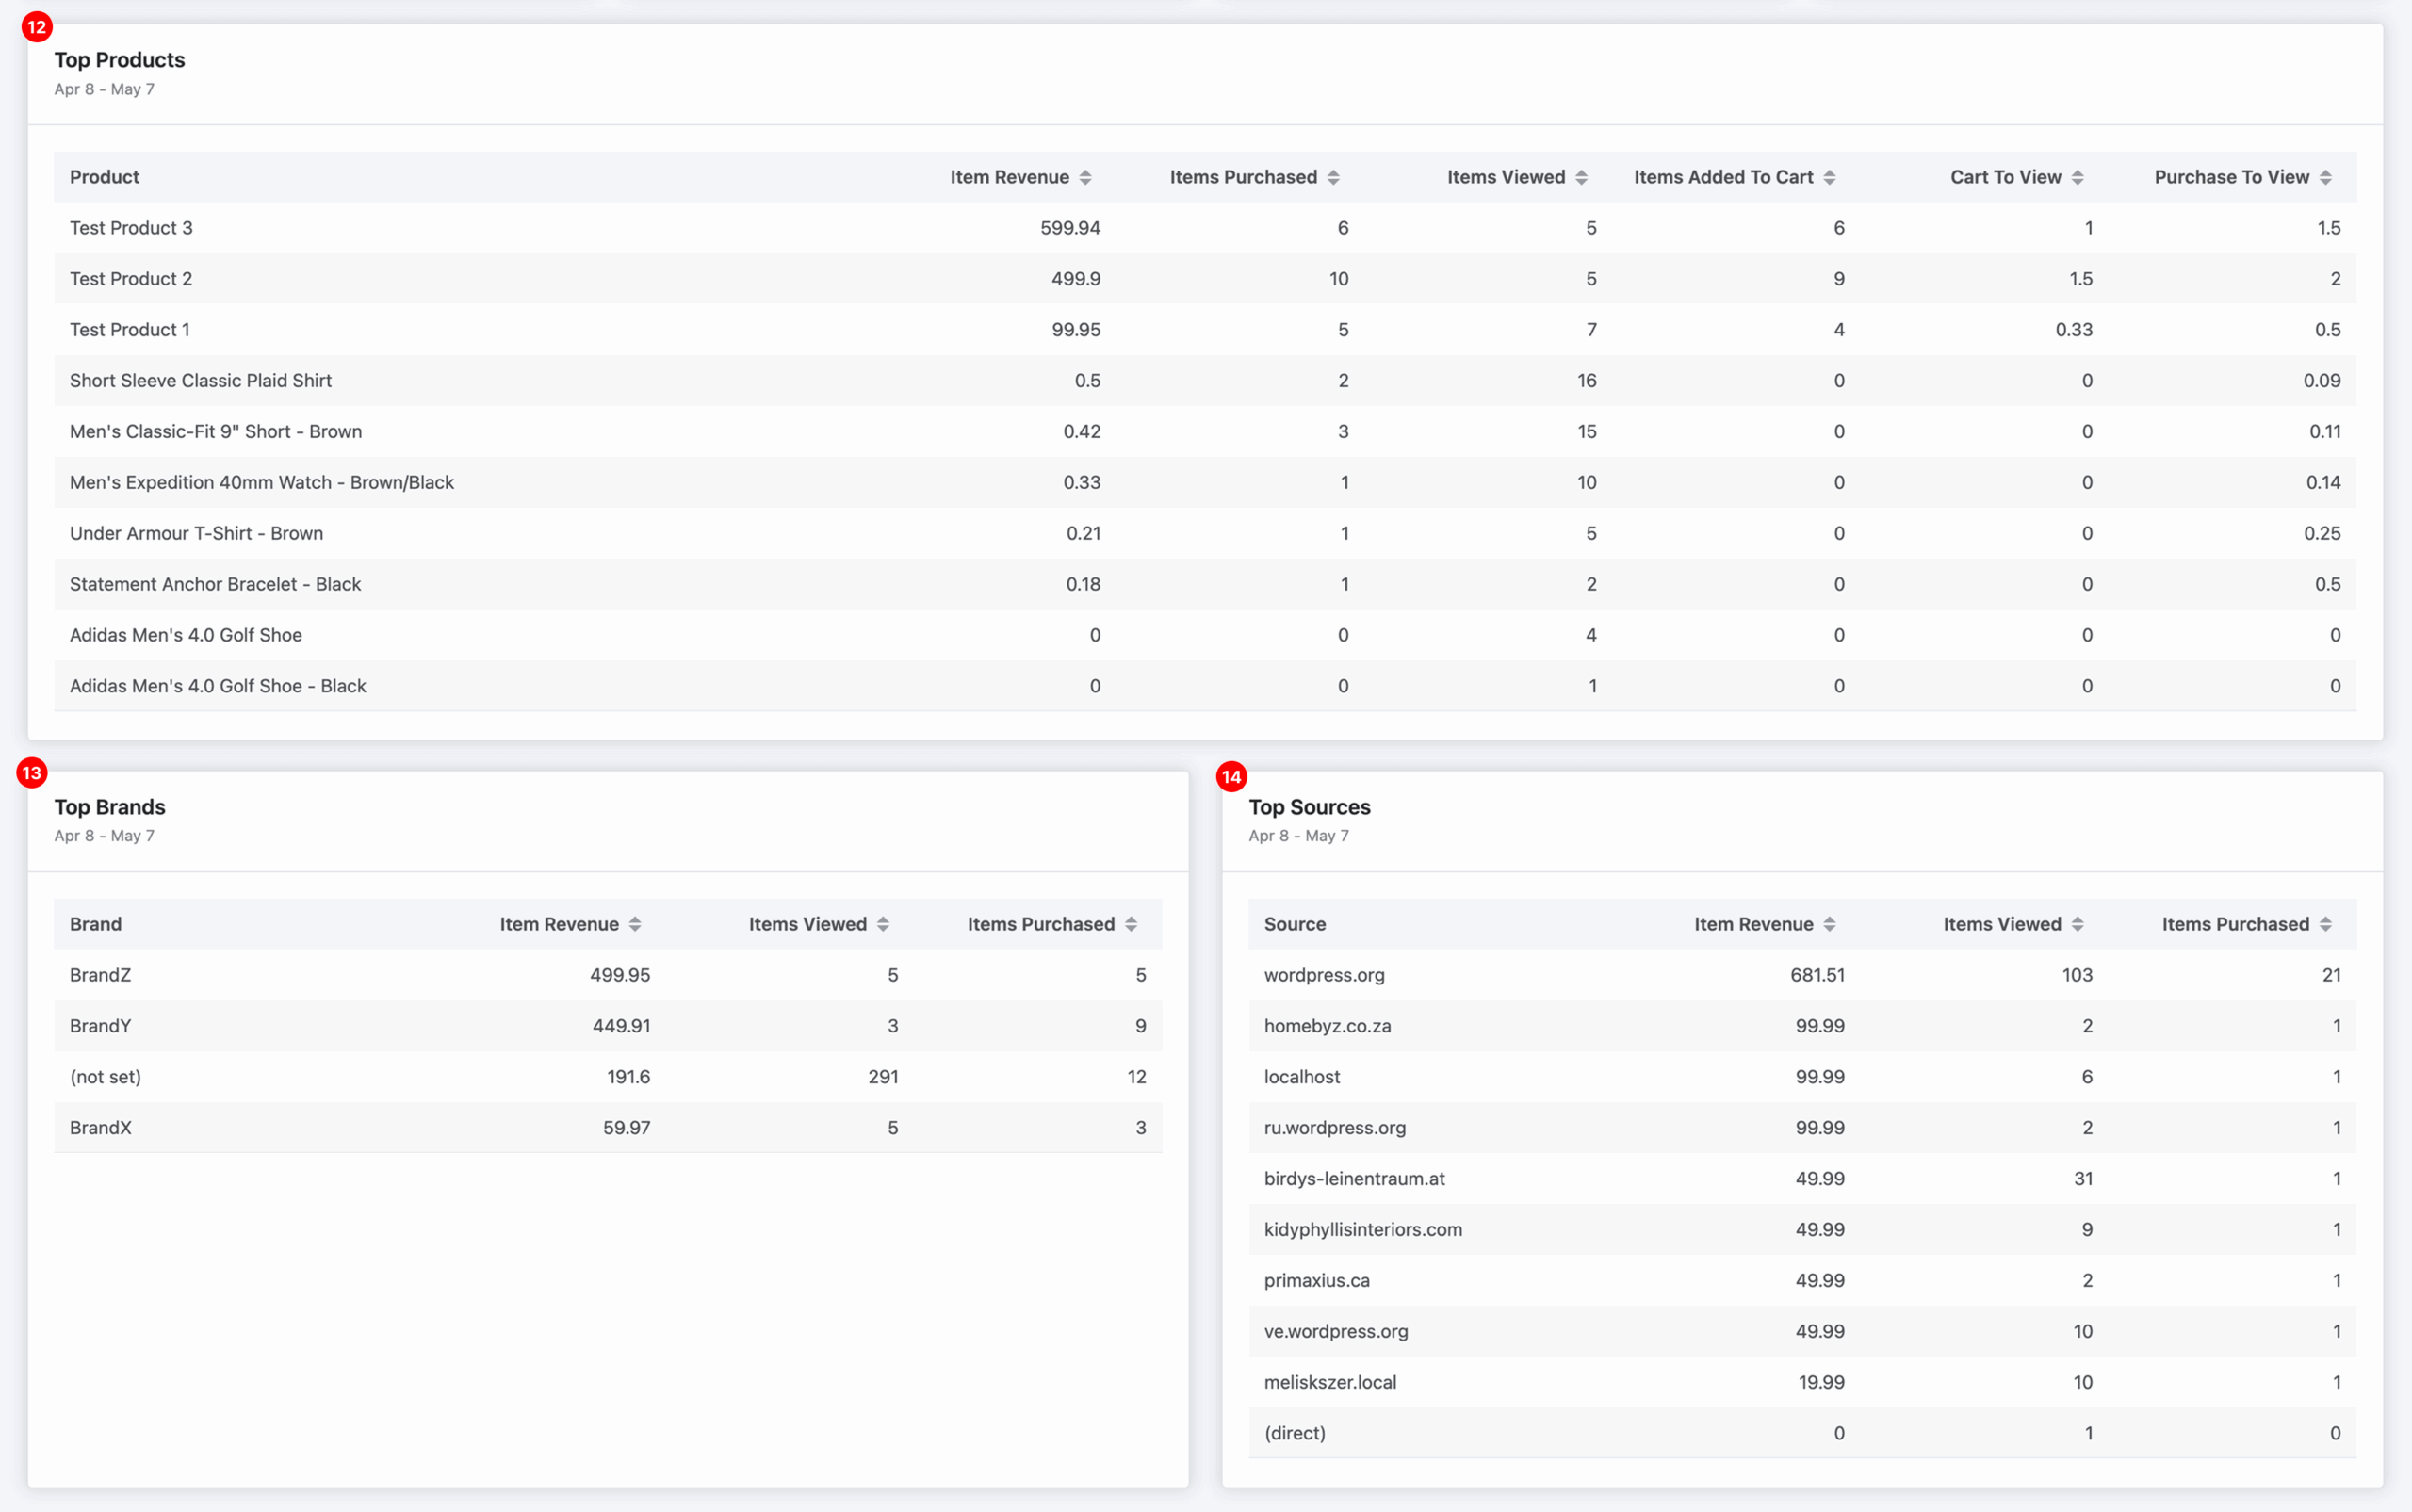
12. Top Products #
This table displays:
- Item Revenue
- Items Purchased
- Items Viewed
- Items Added to Cart
- Cart to View ratio
- Purchase to View ratio
It helps identify top-selling and high-performing products as well as underperformers that may need optimization.
13. Top Brands #
Ranks your product brands based on:
- Revenue
- Views
- Units Sold
This data helps determine which brands contribute most to your overall sales.
14. Top Sources #
Lists referral sources by:
- Revenue generated
- Product views
- Purchases
Use this to identify your most valuable traffic sources for targeting and marketing investment.


