Discover the intricacies of generating and interpreting standard reports through this documentation. Uncover valuable insights for informed decision-making.
1. Account & Measurement Overview #
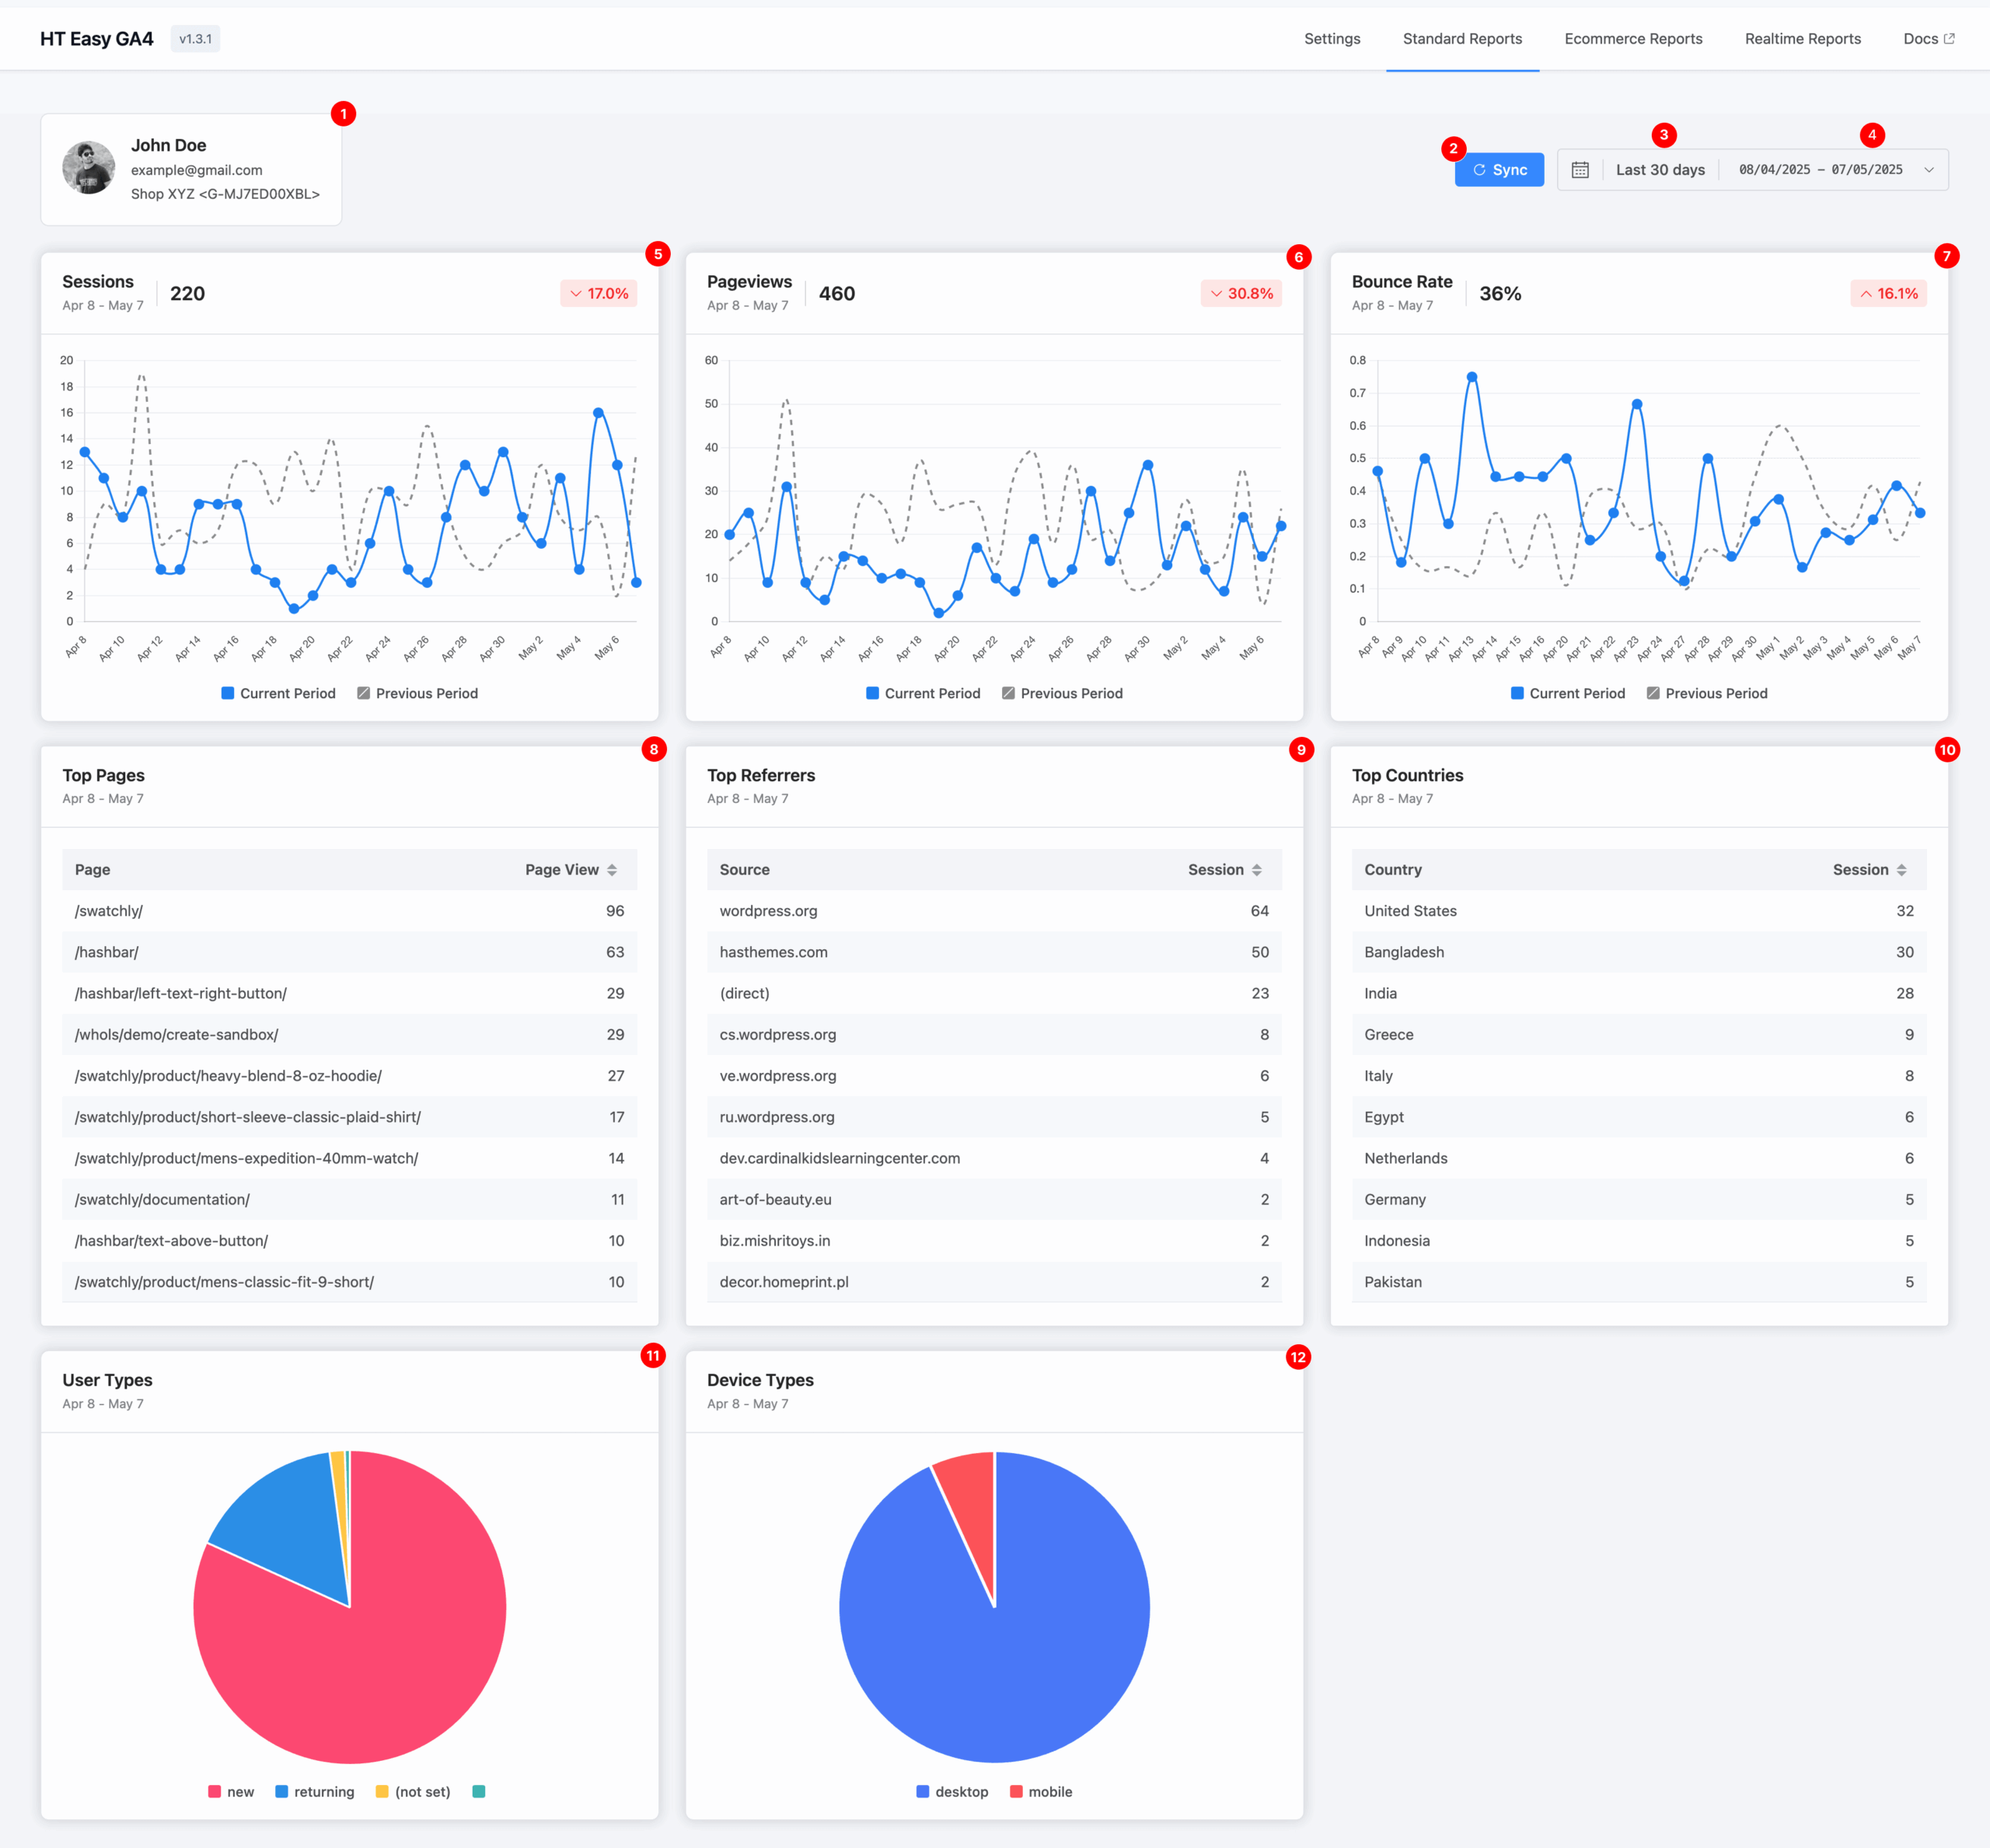
This section displays:
- The Google account currently authenticated.
- The Measurement ID and associated Data Stream name (e.g., “Shop XYZ”) for the report data.
2. Sync #
Click the Sync button to refresh and retrieve the latest data from your GA4 property. This ensures your reports reflect the most current analytics available.
3. Default Date Range #
By default, the dashboard shows data from the last 30 days.
This provides a quick snapshot of your site’s recent activity and performance.
4. Custom Date Range Selector #
Use the calendar selector to define a custom date range.
This flexibility allows you to analyze data for any specific timeframe—useful for tracking campaign performance, seasonal trends, or historical comparisons.
5. Sessions #
A session is a group of user interactions within a single visit to your website.
This metric helps you measure overall engagement and analyze user activity over time.
6. Pageviews #
A pageview represents each time a page on your website is loaded.
This helps you track which content attracts the most attention.
7. Bounce Rate #
A pageview represents each time a page on your website is loaded.
This helps you track which content attracts the most attention.
8. Top Pages #
This section lists the most visited pages on your website within the selected period.
It helps identify high-performing content worth promoting or replicating.
9. Top Referrers #
Displays the top external websites that have sent traffic to your site.
This helps evaluate the success of referral sources, backlinks, or campaigns.
10. Top Countries #
Shows a breakdown of user sessions by country.
Understanding your audience's geographic distribution is crucial for targeting and localization efforts.
11. User Types #
A visual chart shows two types of visitors:
- New users: First-time visitors
- Returning users: Repeat visitors
Use this to measure audience loyalty and retention.
12. Device Types #
Breaks down visitors by device category:
- Desktop
- Mobile
This helps ensure your website delivers a seamless experience across all devices.


