The Report Tab is your feedback command center. View statistics, analyze trends, read comments, and export data to make informed content decisions.
Accessing Reports #
- Go to WordPress Admin → Was This Helpful
- Click the “Report” tab at the top
- You'll see your feedback dashboard
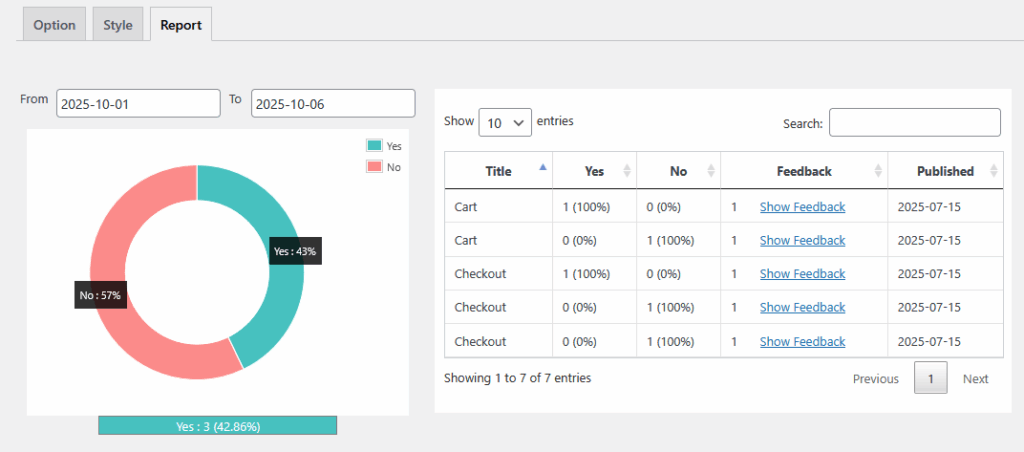
Understanding the Dashboard #
The Report tab has two main sections:
- Visual Analytics (Left side): Pie chart/donut chart
- Data Table (Right side): Detailed feedback list
Visual Analytics Section #
The Pie Chart #
What it shows: Percentage breakdown of positive vs. negative feedback across all posts.
Colors:
- Turquoise/Teal (
Yesvotes): Positive feedback - Coral/Pink (
Novotes): Negative feedback
Reading the chart:
Yes: 2 (100.00%)
━━━━━━━━━━━━
Full circle = All votes are positive

Yes: 5 (62.5%)
No: 3 (37.5%)
━━━━━━━━━━━━
Larger segment = More positive votes
What to look for:
- High positive % (70%+): Your content is helping users
- Balanced split (40-60%): Mixed feedback, room for improvement
- High negative % (60%+): Content needs significant revision
Chart Legend #
Below the chart you'll see:
━━━━━━━━━━━━━━━━━━━
Yes : 2 (100.00%)
━━━━━━━━━━━━━━━━━━━
What it means:
- Number (2): Total “Yes” votes across all posts
- Percentage (100.00%): Proportion of total votes
- Same format for “No” votes
Date Range Filter #
Filter Controls #
At the top of the Report tab:
From: [select start date] To: [select end date]
How to use:
- View specific period:
- From:
2024-01-01 - To:
2024-01-31 - Shows only January 2024 feedback
- From:
- View last 7 days:
- From: 7 days ago
- To: Today
- View all time:
- Leave both fields empty
- Or select your site's launch date to today
Use cases:
- Compare feedback before/after content updates
- Analyze monthly performance
- Check recent feedback trends
- Prepare monthly reports
Data Table Section #
Table Columns #
The data table shows:
| Column | What It Shows | Sortable |
|---|---|---|
| Title | Post/page name | ✅ Yes |
| Yes | Positive votes (count & %) | ✅ Yes |
| No | Negative votes (count & %) | ✅ Yes |
| Feedback | Number of comments received | ❌ No |
| Published | Post publication date | ❌ No |
Reading the Table #
Example row:
Title: "Available Widgets"
Yes: 1 (100%)
No: 0 (0%)
Feedback: 1
Published: 2020-11-18
[Show Feedback]
What it means:
- Post got 1 positive vote (100% positive rate)
- No negative votes
- 1 person left a comment
- Post was published Nov 18, 2020
- Click “Show Feedback” to read the comment
Sorting Data #
Click column headers to sort:
Sort by Title: Alphabetical order (A-Z or Z-A)
A-Z: Available Widgets → Woolentor Free VS Pro
Z-A: Woolentor Free VS Pro → Available Widgets
Sort by Yes votes: See most/least positive posts
- Ascending: Least positive first
- Descending: Most positive first
Sort by No votes: See most/least negative posts
- Ascending: Least negative first
- Descending: Most negative first
Interpreting Percentages #
Understanding the numbers:
Yes: 5 (83%)  |  No: 1 (17%)
= 5 out of 6 total votes are positive
Yes: 1 (50%)  |  No: 1 (50%)
= Evenly split feedback
Yes: 0 (0%)  |  No: 3 (100%)
= All feedback is negative
Reading User Comments #
Accessing Comments #
- Find the post in the data table
- Look at the “Feedback” column (shows comment count)
- Click “Show Feedback” link on the right
What You'll See #
A list of all feedback with:
- User's vote (positive or negative)
- Their comment text
- Date/time submitted
- User's IP address (if needed for spam control)
Example feedback display:
━━━━━━━━━━━━━━━━━━━━━━━━━━
👍 Positive Vote
"This tutorial was exactly what I needed! Clear and concise."
Submitted: January 15, 2024 at 2:30 PM
━━━━━━━━━━━━━━━━━━━━━━━━━━
Analyzing Your Data #
Finding Top Performers #
Method 1: Sort by “Yes” votes (descending)
- Shows your most helpful content
- Double down on what works
- Use as templates for new content
Questions to ask:
- What do top posts have in common?
- What topics get the most positive feedback?
- What format/style works best?
Identifying Problem Content #
Method 2: Sort by “No” votes (descending)
- Shows content needing improvement
- Prioritize revision efforts
- Read comments for specific issues
Action steps:
- Click “Show Feedback” on high-negative posts
- Read all comments to find patterns
- Note common complaints:
- “Too technical”
- “Missing steps”
- “Outdated information”
- “Confusing explanation”
- Update content based on feedback
- Monitor if feedback improves
Reading Zero-Vote Posts #
Posts with no votes:
- May have low traffic
- Might not be relevant to readers
- Could have visibility issues
- Need promotion
Action steps:
- Check traffic in Google Analytics
- Improve SEO
- Share on social media
- Update content to be more current
Time-Based Analysis #
Compare periods:
Example analysis:
- Filter: January 1-31, 2024
- Result: 60% positive
- Filter: February 1-28, 2024
- Result: 75% positive
- Insight: Content quality improved in February
Use cases:
- Measure impact of content updates
- Track improvement over time
- Identify seasonal trends
- Evaluate new writers/contributors
Exporting Data #
Export Options #
While the plugin doesn't have built-in export, you can:
Method 1: Screenshot
- Take screenshot of chart and table
- Good for presentations/reports
Method 2: Manual Copy
- Copy table data to Excel/Sheets
- Add to monthly reports
Method 3: Browser Print
- Print to PDF from browser
- Save as record
Pro tip: Regular screenshots help track trends over time.
Key Metrics to Track #
Overall Satisfaction Rate #
Formula: (Total Yes votes ÷ Total votes) × 100
Example:
- Total Yes: 45
- Total No: 15
- Total votes: 60
- Satisfaction rate: (45 ÷ 60) × 100 = 75%
Benchmarks:
- 80%+: Excellent
- 70-79%: Good
- 60-69%: Fair, room for improvement
- Below 60%: Needs attention
Comment Rate #
Formula: (Posts with comments ÷ Total posts with votes) × 100
What it means:
- High comment rate (30%+): Users are engaged
- Low comment rate (<10%): Consider prompting more
How to improve:
- Better prompt messages
- Ask specific questions
- Make comment box more visible
Response Time #
Track: How quickly you address negative feedback
Best practice:
- Check reports daily
- Update content within 1-2 weeks
- Re-check feedback after updates
Taking Action on Data #
Monthly Review Process #
Step 1: Export monthly data
- Filter by last month
- Screenshot chart and table
Step 2: Identify patterns
- Which posts got most negative feedback?
- Which topics perform best?
- What common complaints appear?
Step 3: Create action plan
Priority 1: Posts with >50% negative feedback
Priority 2: Popular posts with mixed feedback
Priority 3: New content based on positive topics
Step 4: Update content
- Fix identified issues
- Add missing information
- Update outdated details
- Improve clarity
Step 5: Monitor results
- Check feedback again after 30 days
- Measure improvement percentage
Setting Up Feedback Alerts #
While the plugin doesn't send automatic emails, you can:
Option 1: Regular schedule
- Check reports every Monday
- Review new feedback
- Add to calendar
Option 2: RSS/monitoring
- Check WordPress dashboard daily
- Look for new feedback count
Option 3: Custom notification
- Ask developer to add email notifications
- Set up database monitoring
Creating Reports for Stakeholders #
Monthly Report Template #
CONTENT FEEDBACK REPORT
Month: January 2024
━━━━━━━━━━━━━━━━━━━━━━━━

OVERVIEW
• Total votes: 150
• Positive votes: 120 (80%)
• Negative votes: 30 (20%)
• Comments received: 45

TOP PERFORMERS
1. "How to Install WordPress" - 95% positive
2. "Beginner's Guide to SEO" - 92% positive
3. "Email Marketing Tips" - 88% positive

NEEDS IMPROVEMENT
1. "Advanced PHP Tutorial" - 35% positive
2. "Server Configuration" - 42% positive

ACTION ITEMS
• Update PHP tutorial with clearer examples
• Add video to server config guide
• Create more beginner-friendly content
Advanced Analysis Tips #
Segment by Content Type #
Compare feedback across:
- Tutorials vs. Articles
- How-to guides vs. Opinion pieces
- Long-form vs. Short-form content
Track Individual Authors #
If multiple authors:
- Which author gets best feedback?
- What can others learn from them?
Seasonal Trends #
- Do certain topics perform better in specific months?
- Plan content calendar accordingly
Common Questions #
Q: How often should I check reports? A: At least weekly. Daily if you publish frequently.
Q: What's a good positive feedback percentage? A: 70%+ is good, 80%+ is excellent.
Q: Should I respond to every negative comment? A: Update content based on feedback, rather than individual responses.
Q: Can I delete spam feedback? A: Currently no built-in option. Contact support for database cleanup.
Q: How far back does data go? A: All feedback since plugin installation is stored.
Need help? Contact support through our support channel: Contact us


